Seeing the World as 1000 People
How I Learned Content Strategy Informed Design Systems for the TED Conference
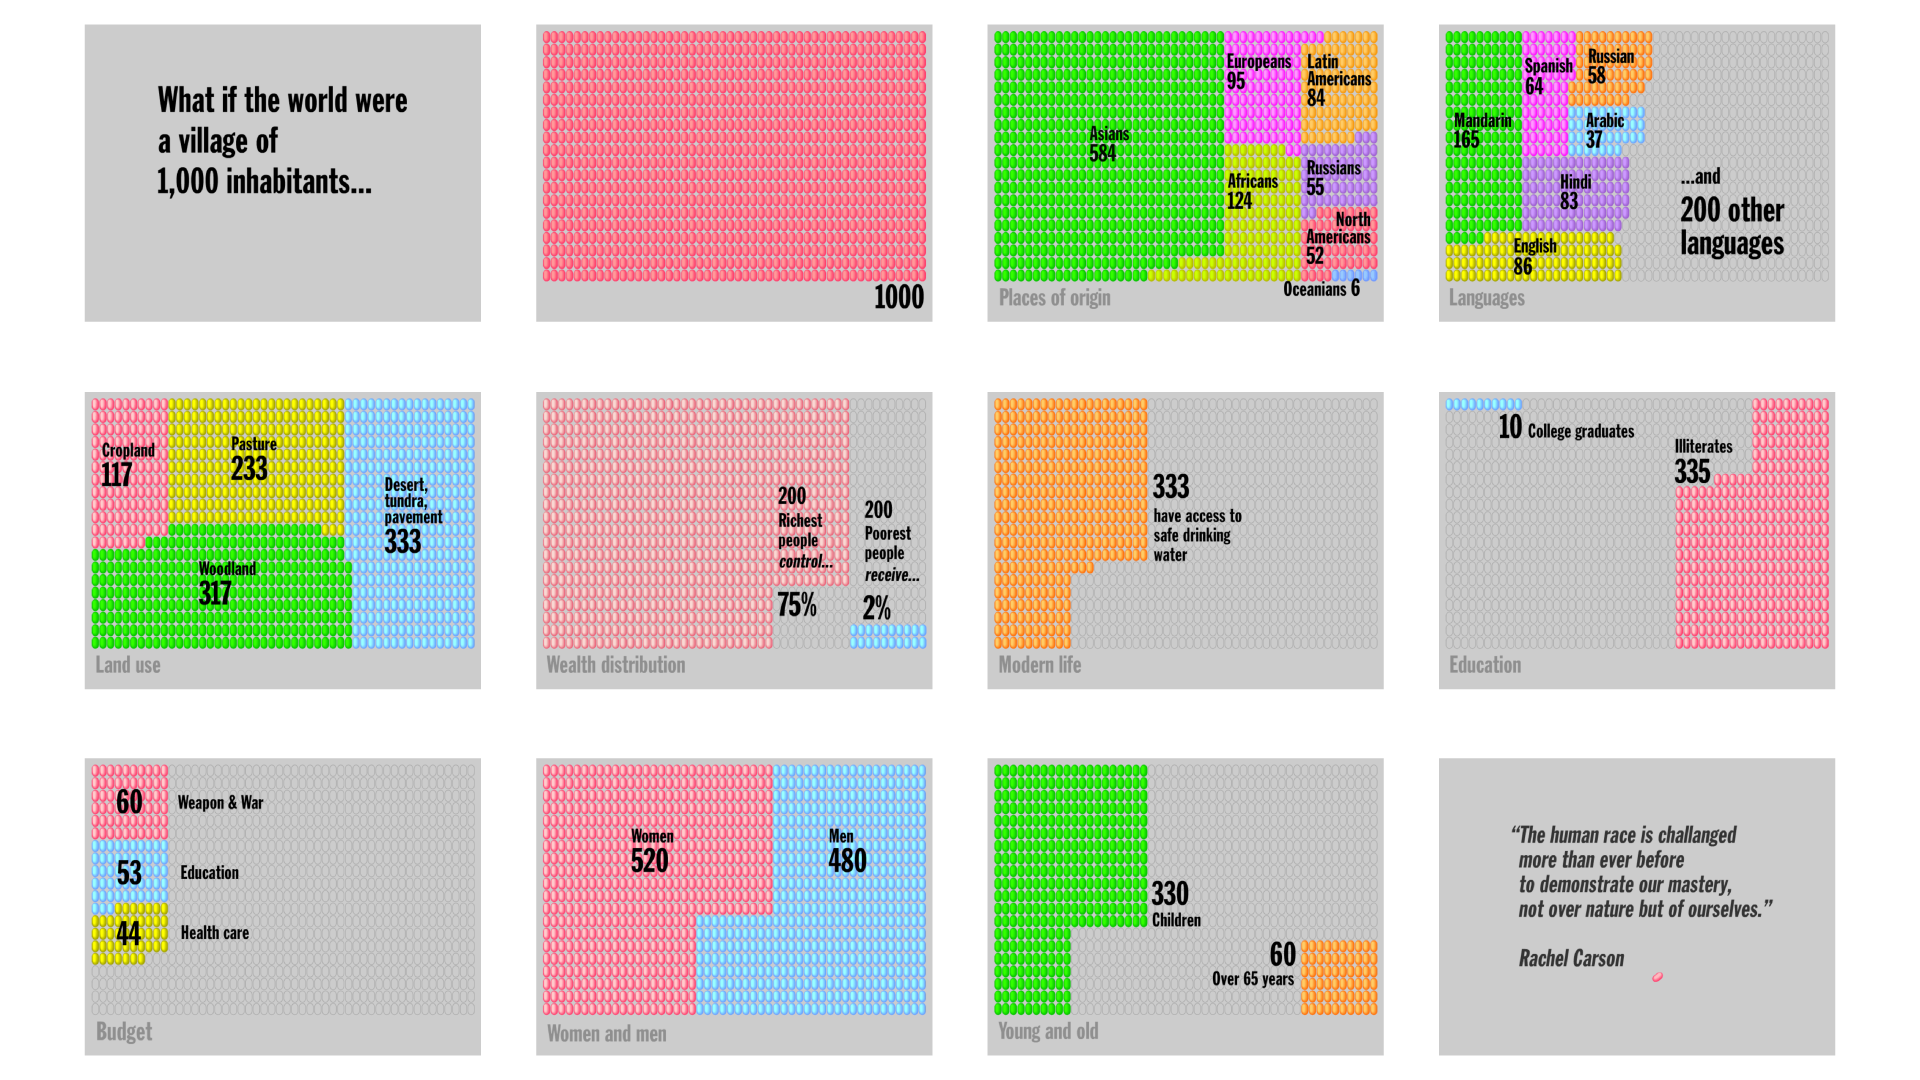
Twenty years ago, I worked on a project called Global Village. It was a data visualization animation presented at TED in the year 2000, and was greeted by a standing ovation.
Last year, I was saddened to find out that Krzysztof Lenk had passed away. He was one of my favorite teachers at RISD. I exchanged a message with his son Jack, who mentioned:
… one of the pieces I found (from my father’s work archive) was that Global Village animation — still looks great after all these years!
Because Global Village was one of the most important early projects that I had the honor to work on with Krzysztof, I dug into my archives and watched it again. Jack was right: even after 20 years, the animation looked fresh and crisp, with almost a timeless quality. This sparked my curiosity as to why.
There are still many key elements in Global Village’s design that remain relevant to today’s UX and information design practitioners. I realized that I learned so much from this project — insights that have been shaping my work ever since. I would like to share them here.

The power of a core concept
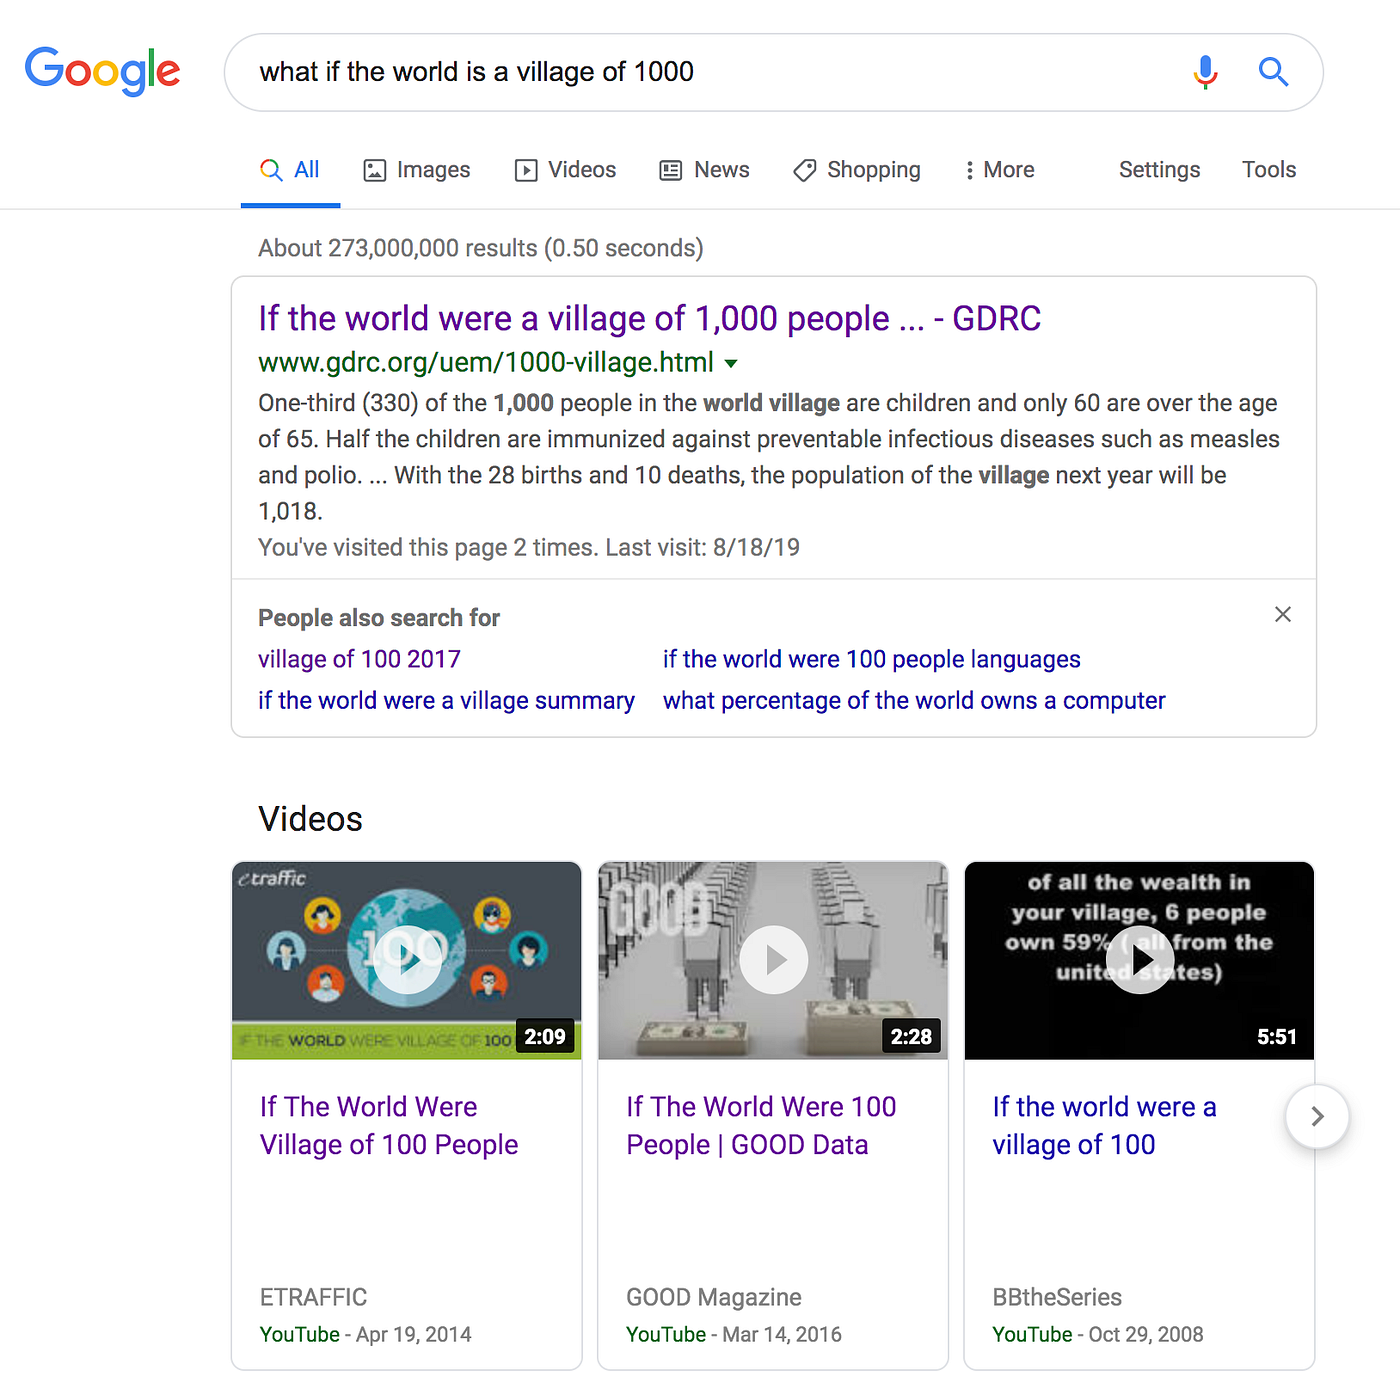 Google search result: “what if the world is a village of 1000” — 273 million results
When you Google “what if the world is a village of 1000,” you get 273 million results. This is the core concept we used for the Global Village animation 20 years ago, borrowed from the World Village Project.
The concept of compressing the 7.7 billion world population down to 1000 to get a clear picture of the earth’s overview was a brilliant idea. No question.
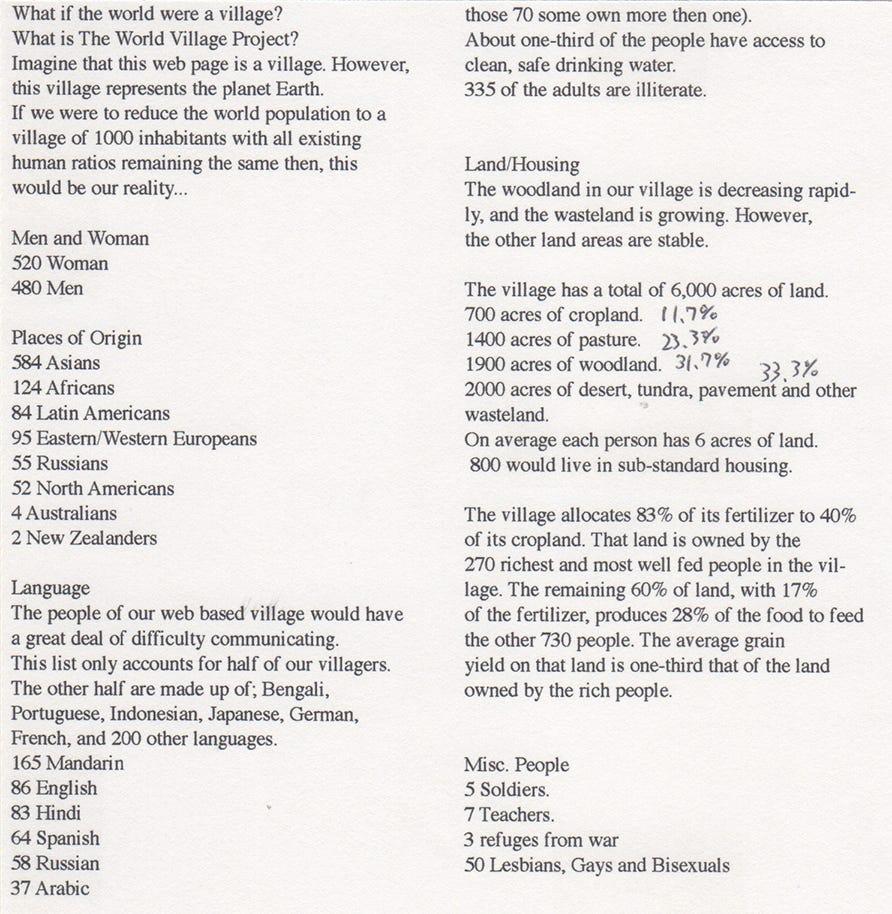 The core concept of Global Village, described in text
There’s no surprise that so many people are attracted to this concept and have visualized it in so many different ways. This is a great example of how a core concept at the content level plays a significant role in creating quality design to begin with.
But when you take a closer look at various visualizations, you start to realize that design is so subjective — with so many possible directions to go, depending on designers’ intentions, decisions, and interpretations.
Design is subjective
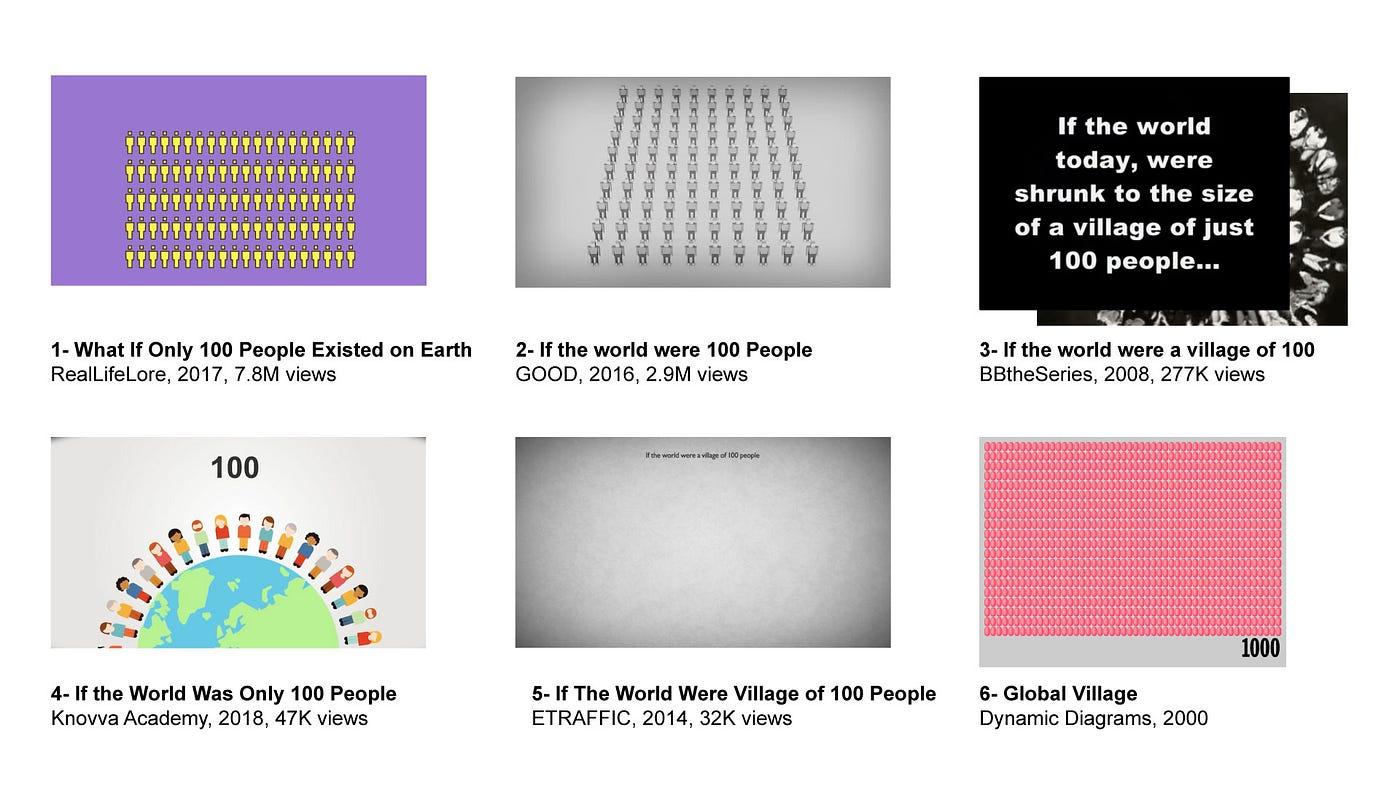 Six different visualizations of the same concept: from top-left — What if Only 100 People Existed on Earth (RealLifeLore, 2017, 7.8M views) · If the world were 100 People (GOOD, 2016, 2.9M views) · If the world were a village of 100 (2008, 277K views) · If the World Was Only 100 People (2018, 47K views) · If The World Were Village of 100 People (2014, 32K views) · Global Village (Dynamic Diagrams, 2000)
Each has its own design and visual style, remarkably different from each other. The number of possible visual design styles is endless. Each designer has their own style, and each viewer has their own preference.
Any visual design style is fine as long as it works. But it has to work across the entirety of a piece, not just in one particular scene or section. And ideally, the design system should help its audience understand the content more clearly.
Subtractive rather than additive
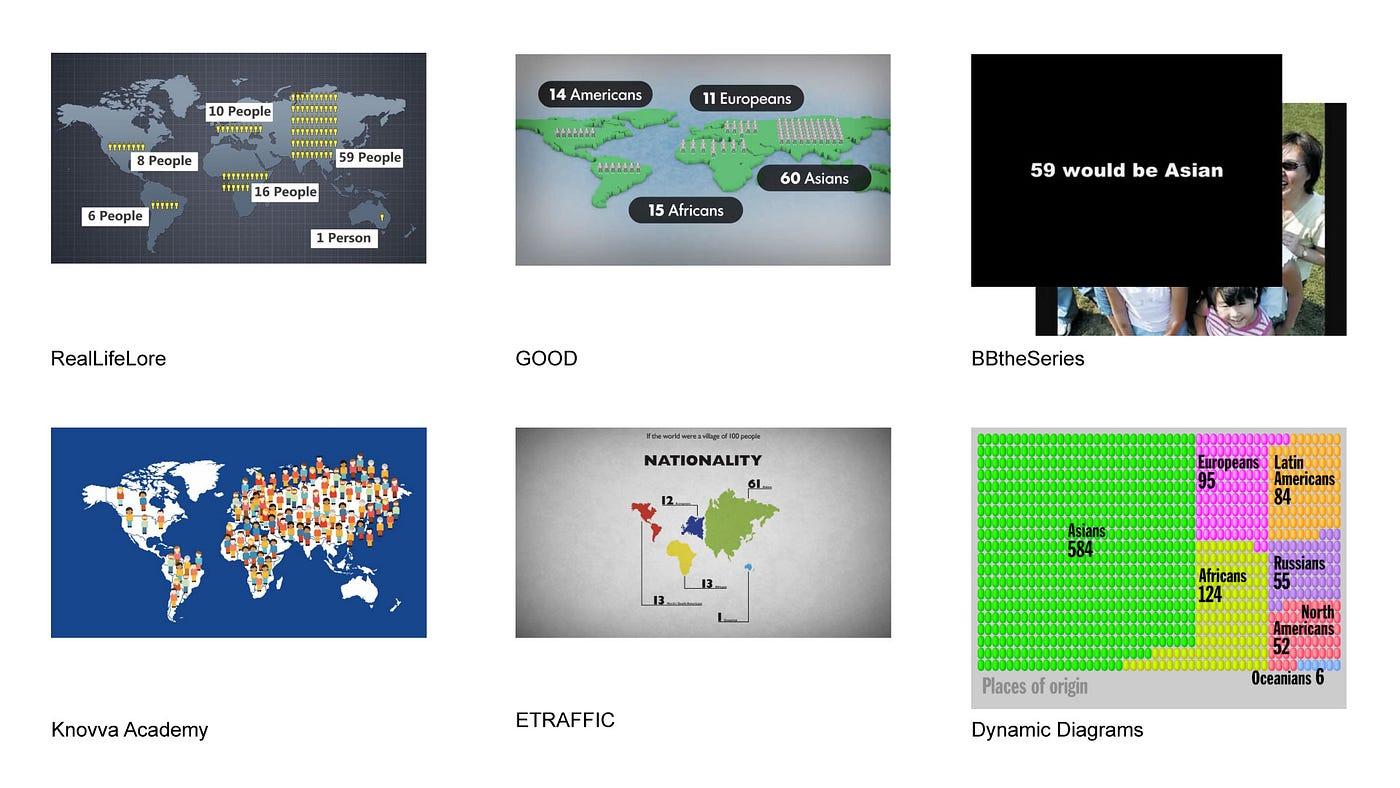 How “place of origin” is visualized differently by different designers
The above shows screenshots from the same videos visualizing population by place of origin. Because it’s about geographic population, having a world map makes logical sense. However, a designer should ask before jumping to that conclusion:
- Does adding a world map enhance understanding of the data?
- Would a world map introduce another visual element that could clutter the screen?
- How does it affect consistency and cognitive load when some statistics are displayed on a map while others aren’t?
- What story do you want the map to tell — population of each region, or population density relative to land area?
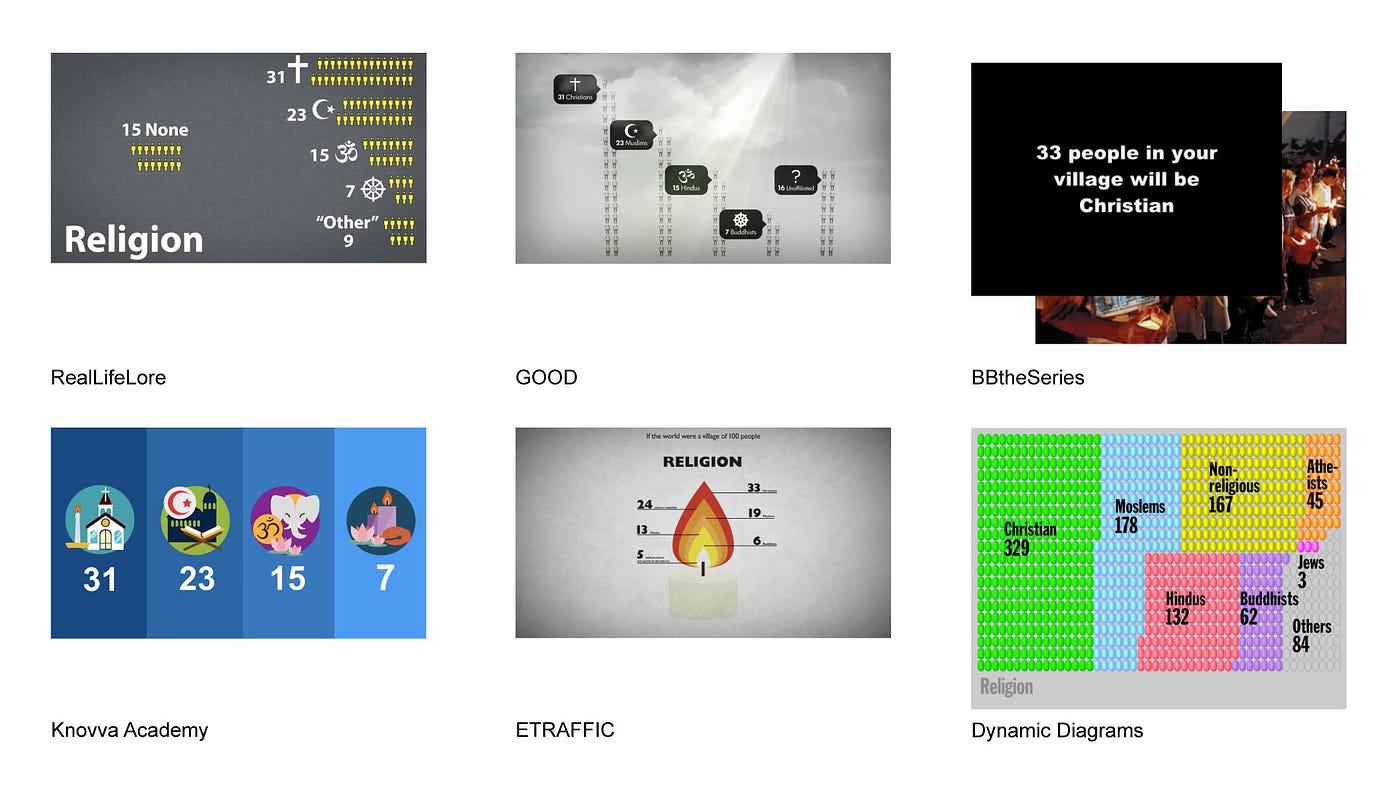 How “religion by population” is visualized differently by different designers
More screenshots showing religion statistics. While illustrations and symbols are visually appealing, it’s not always immediately clear which symbol represents which religion. A voice-over helps, but if a viewer misses the audio, understanding breaks down.
Consistency and repetition enhance learnability
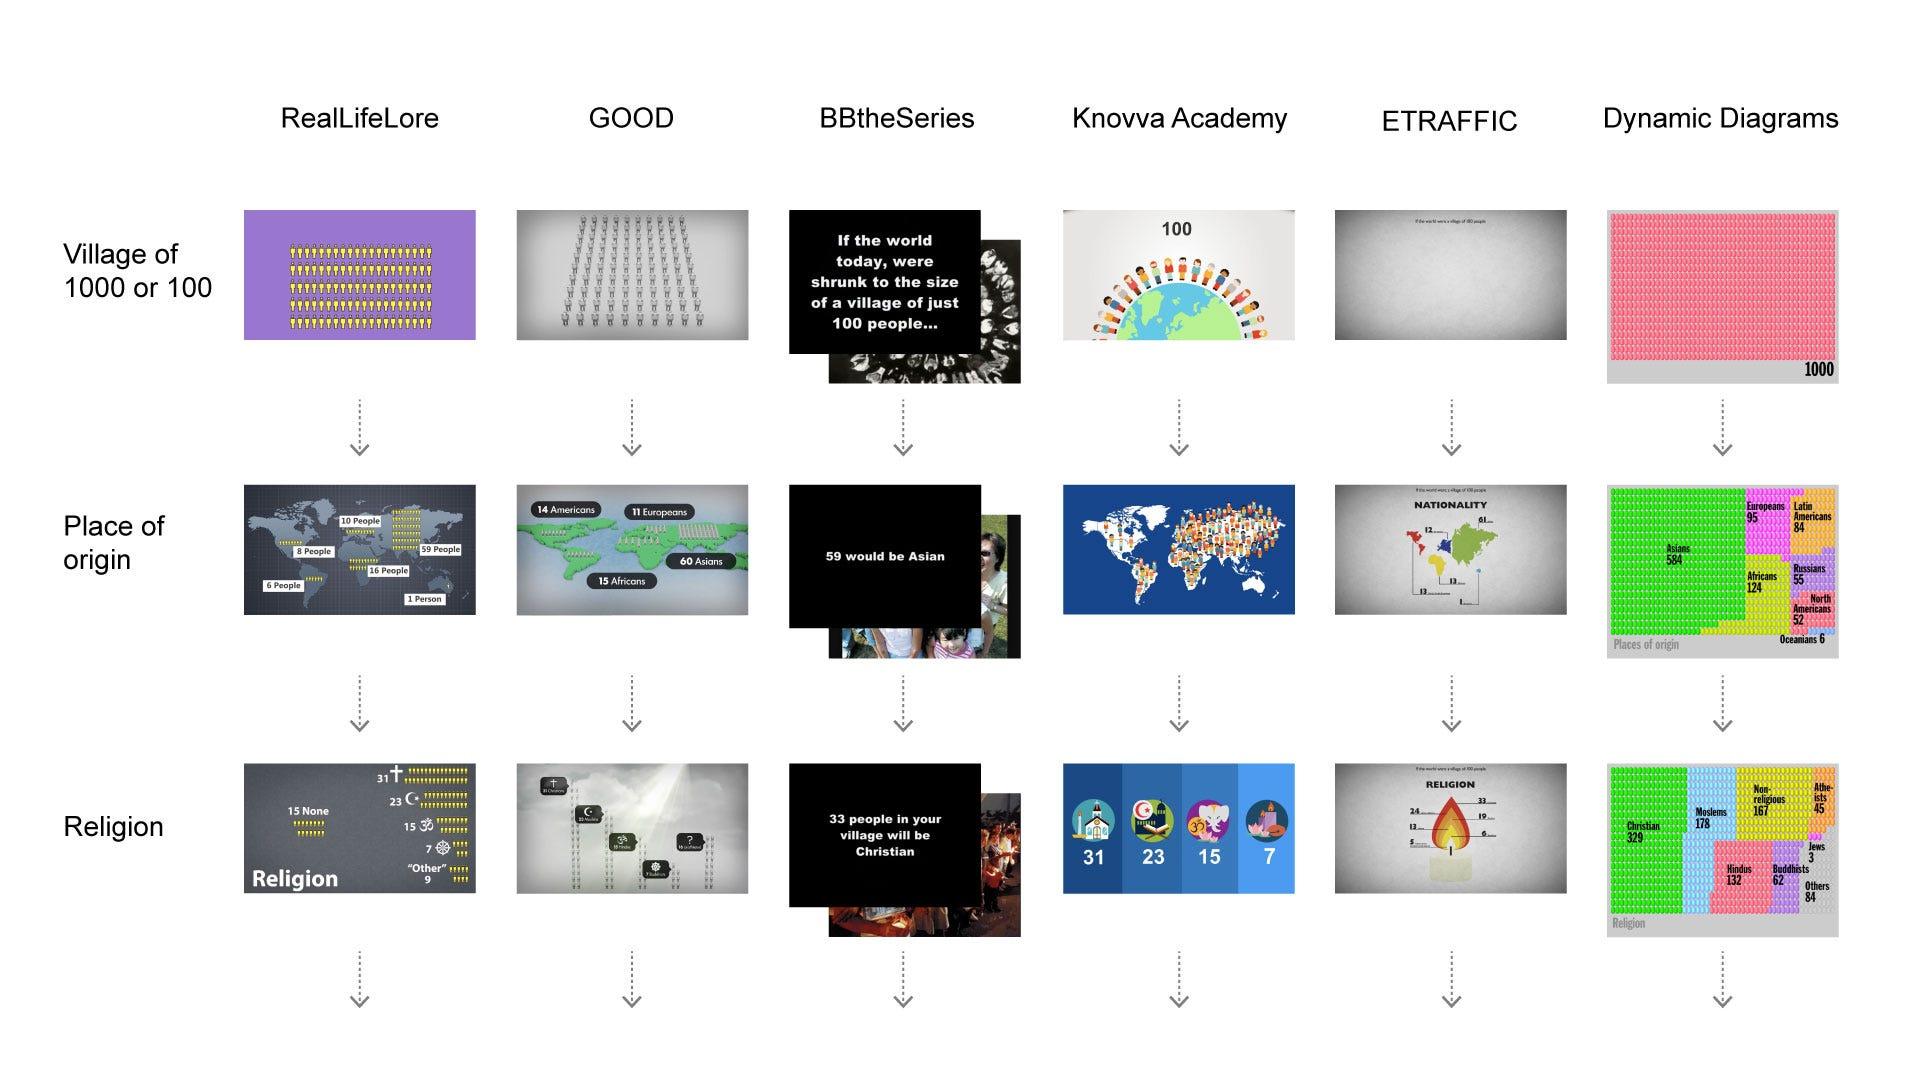 How each video builds up its design system as it progresses — some more consistently than others
The diagram above shows how each video starts to build up its design system as it progresses. As a designer, questions you should be asking are:
- How important is consistency?
- Or is breaking consistency and continuously surprising the viewer the main intention?
- If consistency is important, why?
- Which parts specifically should be consistent?
- What is the right balance between strict consistency and freedom?
Content strategy
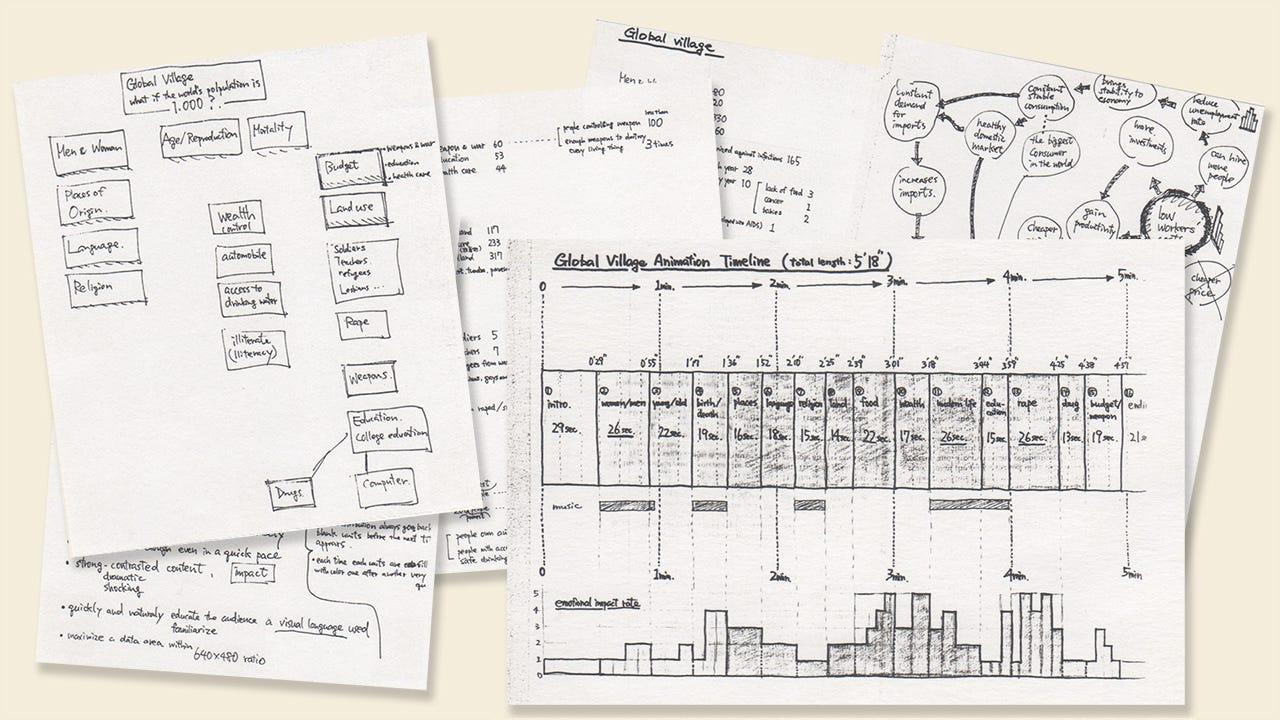 My original notes during the process of the project
In order to answer these questions, you need to understand the content. You need to be crystal clear about the core message you are going to deliver to viewers. To get there, you need to work on content analysis and content strategy.
Content analysis means carefully going over all available content and examining what it means. Some questions to explore:
- What are the implications?
- What are the interesting facts? The shocking facts?
- What emotion do you get when you see certain data?
- Does showing certain statistics in a particular order enhance understanding?
- Are some statistics related to each other? Are there any contrasting ones that could be paired?
Once you answer all these questions, you start to get a clear picture of how the content should be laid out — in what sequence — to tell a compelling story. That is content strategy.
Here is the content strategy for the Global Village project:
In order to present so much information spanning so many topics, we needed to minimize cognitive load so viewers could fully focus on the content itself. This meant:
- Minimum visual elements and clutter
- Repetitive and consistent layout and animation sequence per scene
- Audio playing a secondary, supportive role — not setting a forced pace with background music or taking a dominant role with voice-over
- Content laid out in a sequence that flows well from one topic to another
- Let the data itself tell a story by allowing viewers to purely focus on the numbers
- Keep reinforcing the core concept of “what if a world is a village of 1000” by always showing an empty 1000-unit screen before starting every single topic
As a designer, it’s important to have a deep understanding of the content your product deals with in order to make its user experience as good and appropriate as possible. This should be done collaboratively with UX researchers, UX writers, technical writers, product managers, and engineers.
Content strategy to a design system
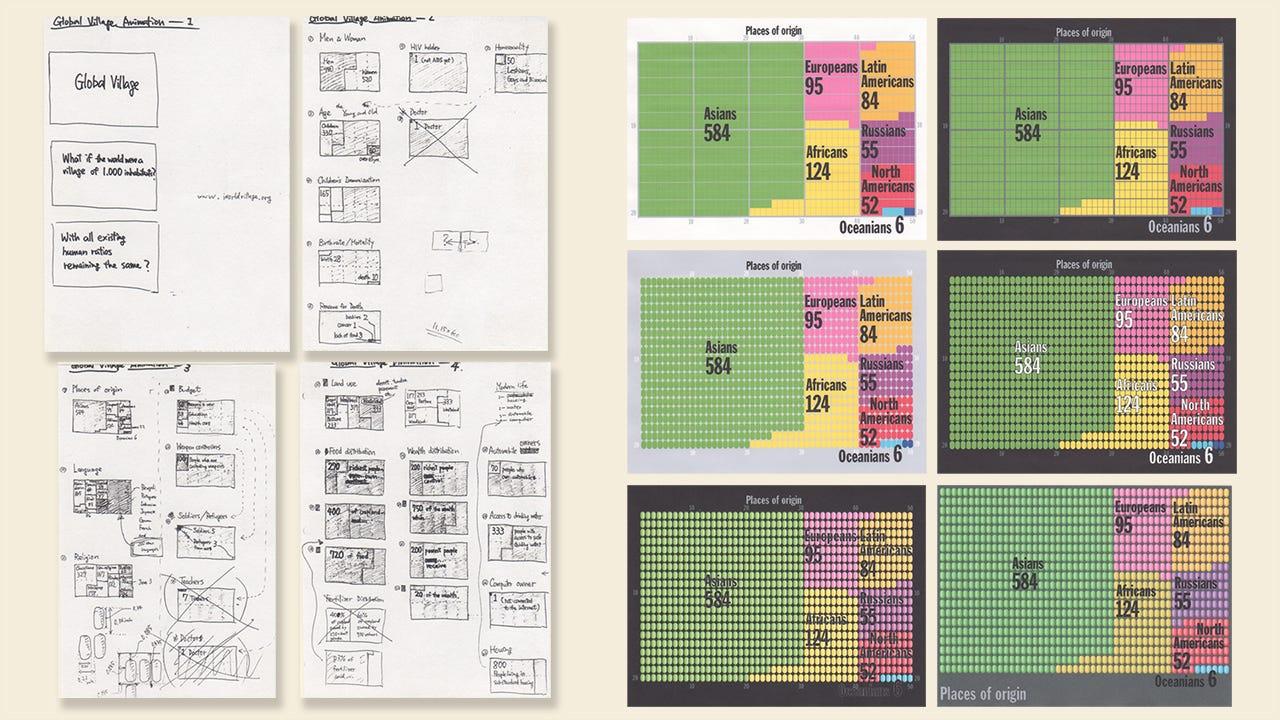 Left: My original sketches on overall sequence · Right: Design studies on various shapes and color combinations
A designer has the power — and responsibility — to create a system for the product they design. A design system should be created in a way that fits the content and the context of the product, so that the experience is easy to understand and delightful to use for its target users.
In order to do so, a designer needs a deep understanding of the content. Only through this deep understanding can a UX designer create a design direction where all efforts move toward a unified goal — resulting in a design system deeply integrated with the content strategy.
A well-thought-out design system can educate a user through repetitive patterns so that users naturally learn how things work just by using them, allowing them to focus purely on the content or the task itself. When that is achieved, design becomes transparent.
Subtract without losing quality
Today, data visualization is one of the hottest areas in design, with enormous amounts of data being captured automatically. UX and information designers are increasingly responsible for how to visualize data in an easy-to-understand manner without causing information overload. Simplicity is the key. How to subtract as many visual elements as possible without losing quality and meaning becomes critical.
Below are three animation designs from start to finish, each represented in a progression of screenshots.
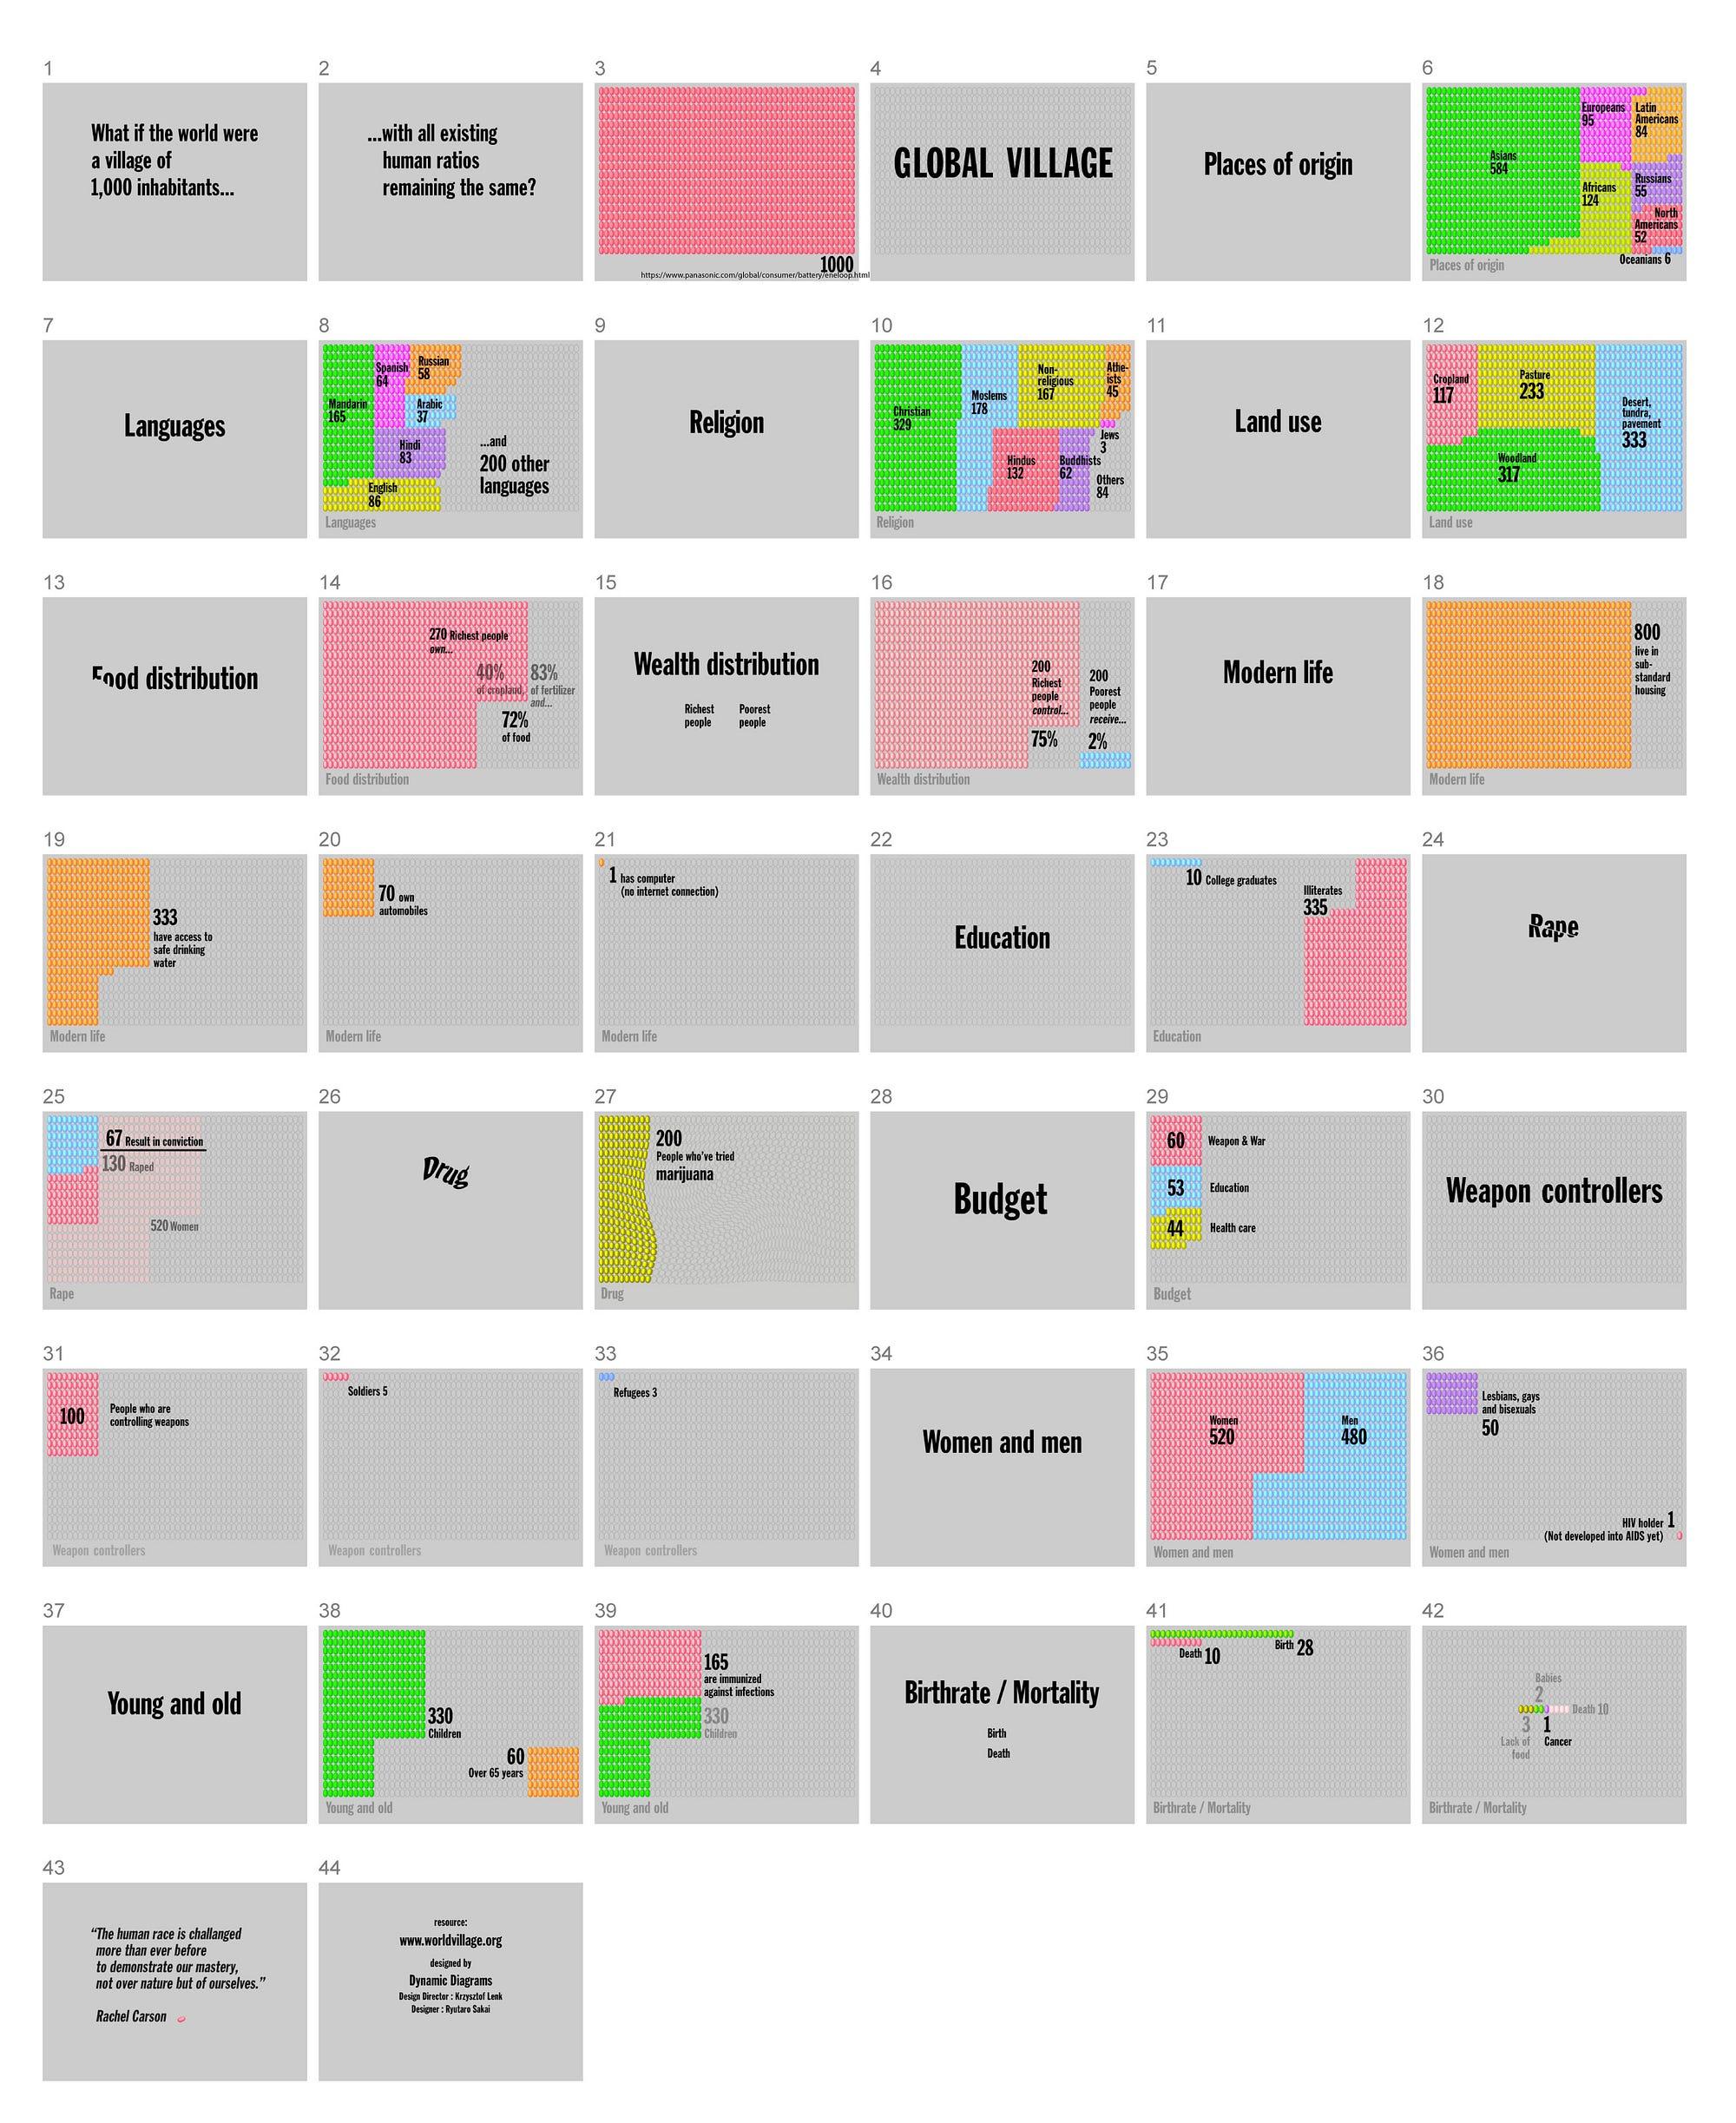 Global Village, Dynamic Diagrams, 2000
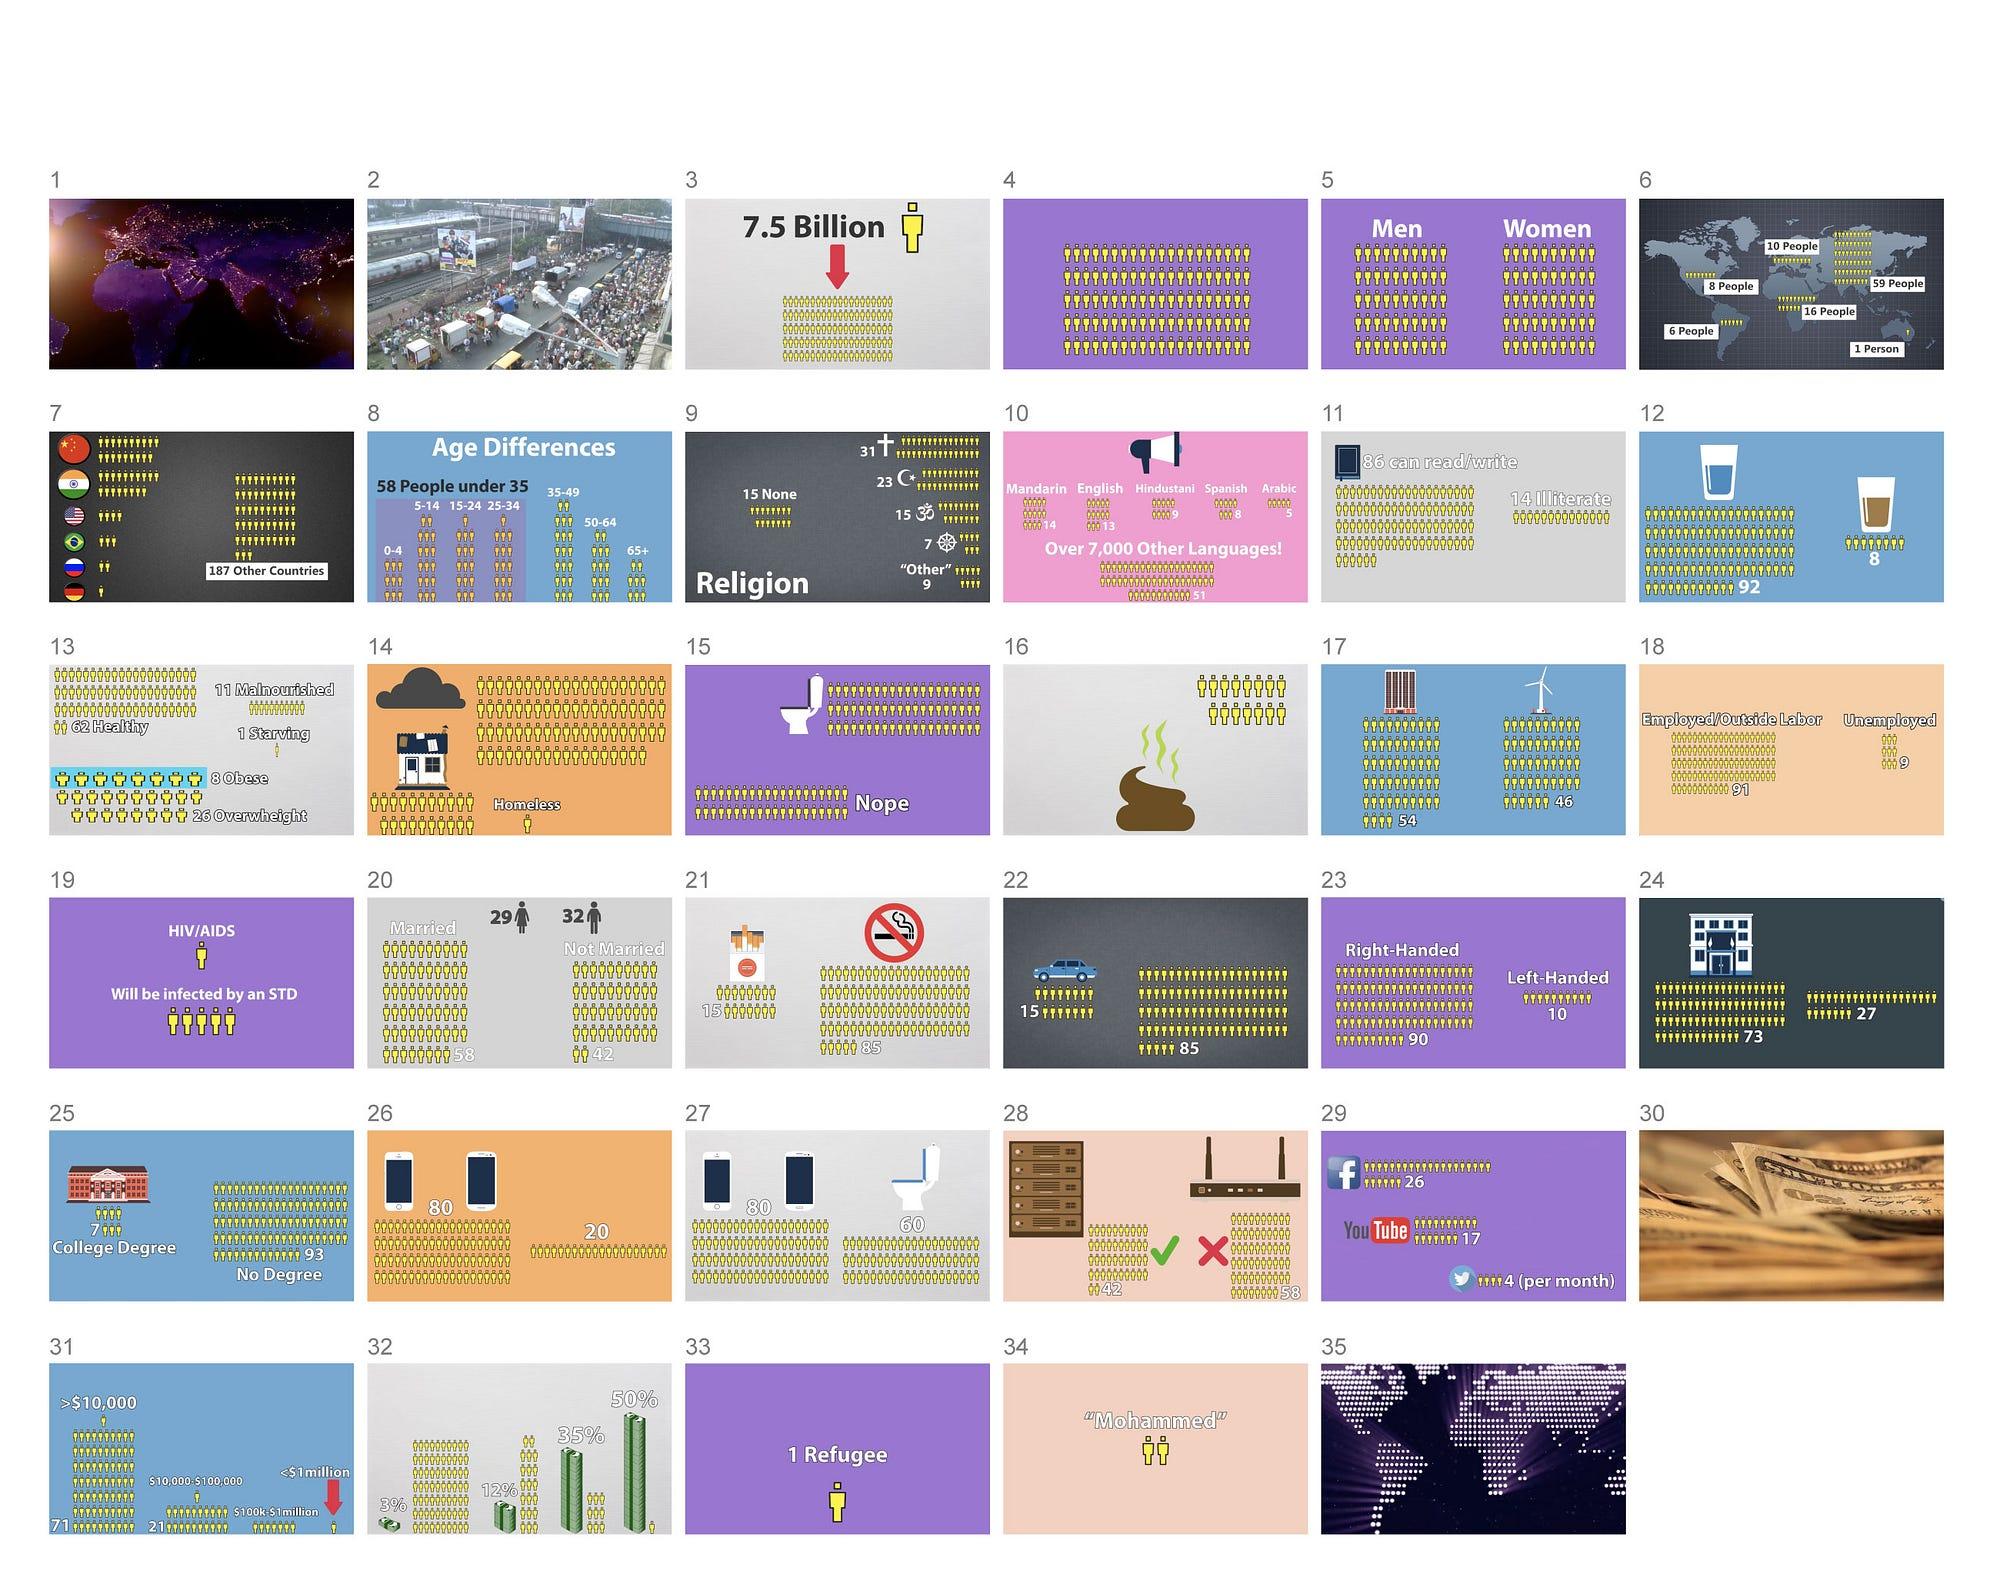 What if Only 100 People Existed on Earth, RealLifeLore, 2017
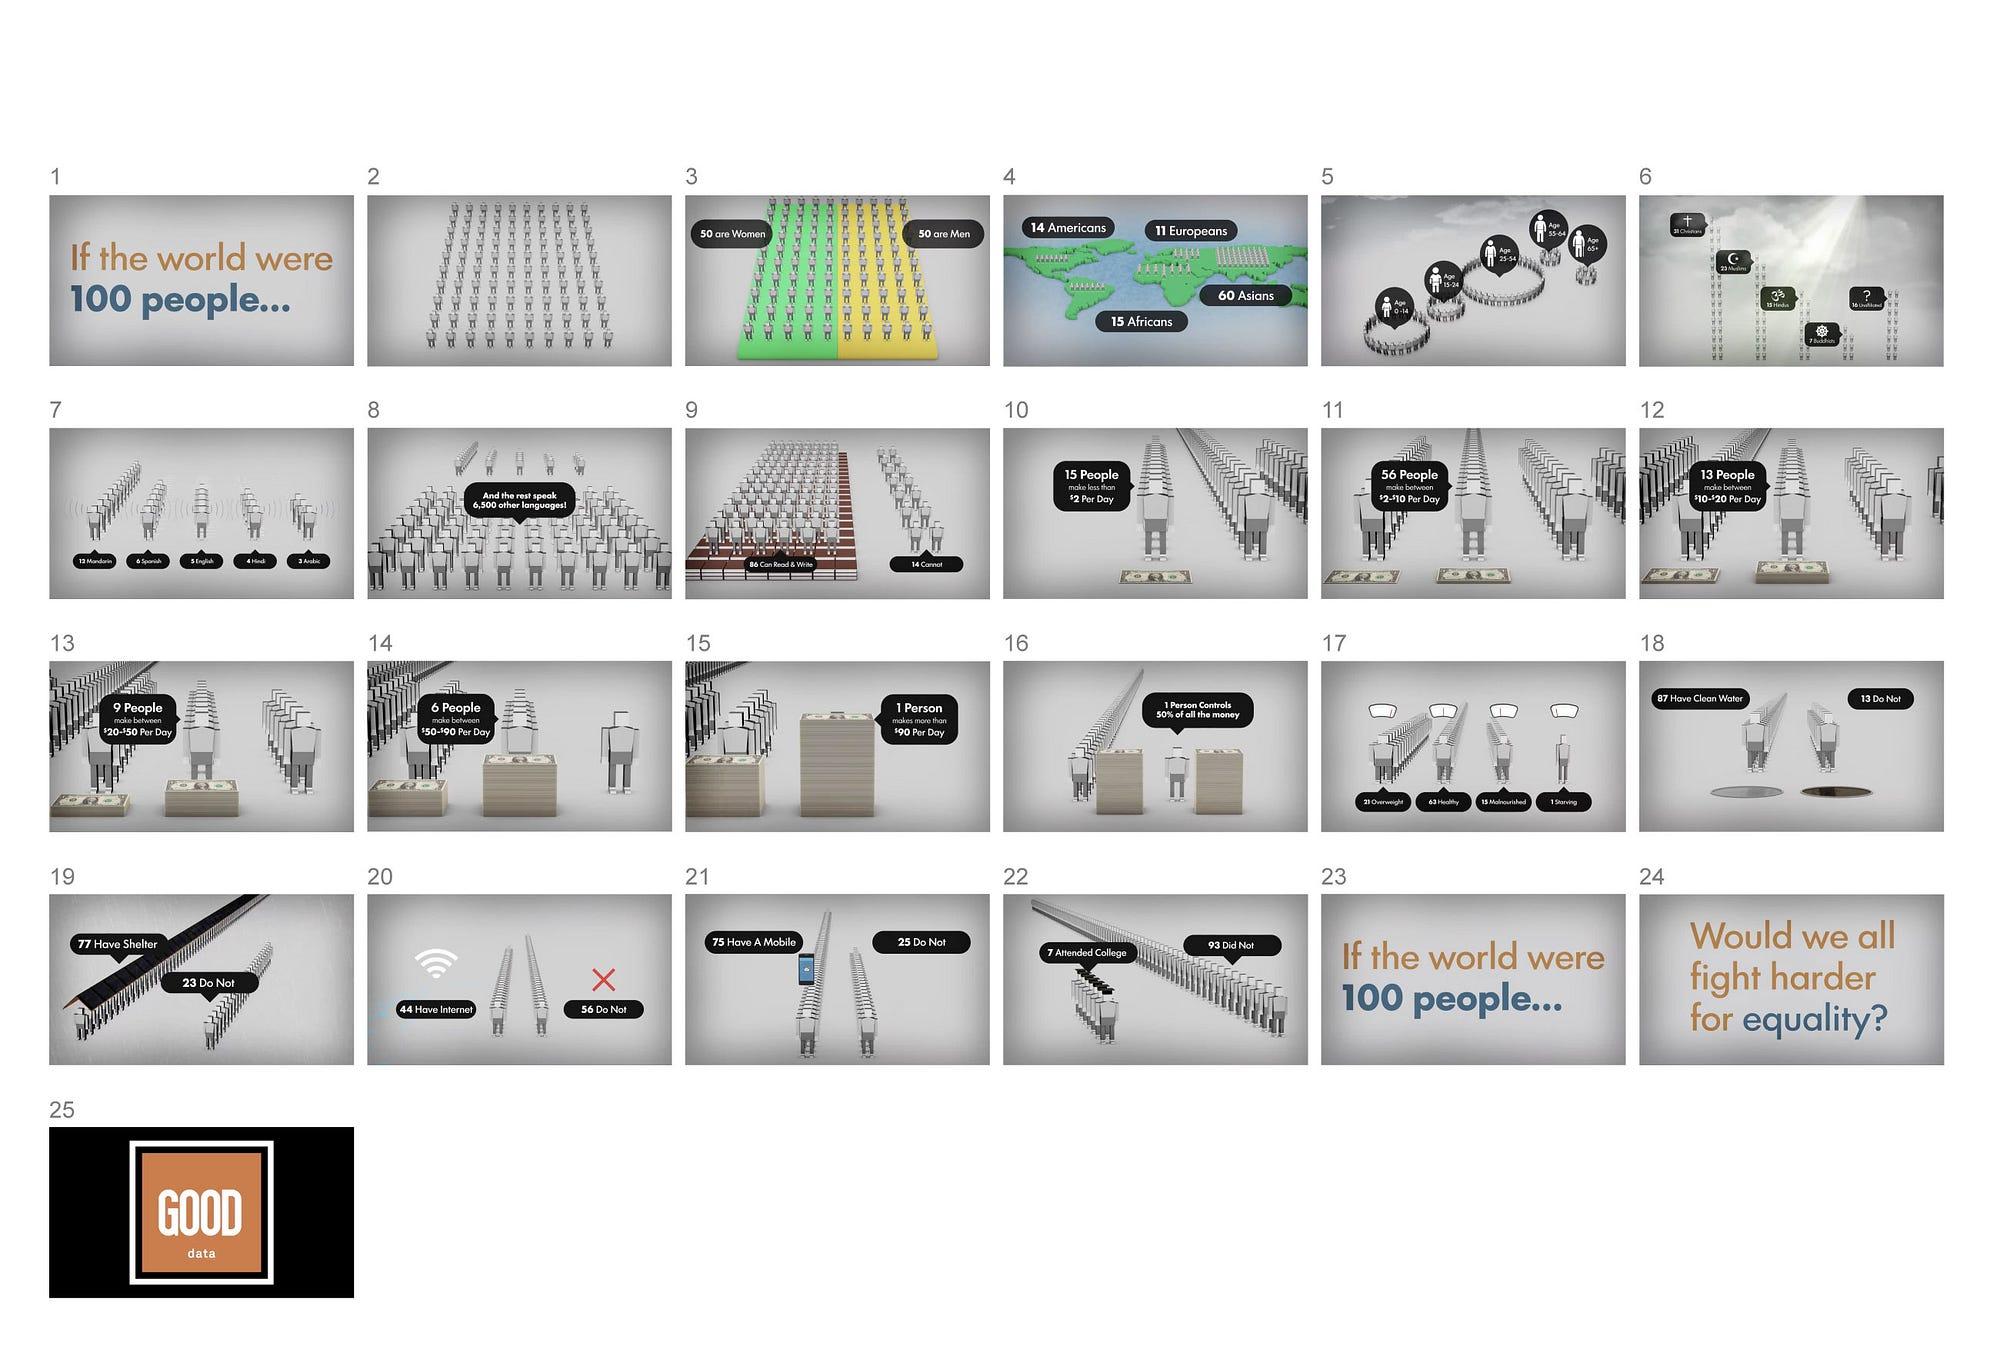 If the world were 100 People, GOOD, 2016
While criticizing others is not my intention, when you look at all three designs together, it becomes obvious and safe to say that Dynamic Diagrams has the most consistent and clear design system — one that carries through consistently from start to finish.
After all, it’s user-centered design
It’s all about how to make things as easy and clear as possible for the user. It’s not about pleasing yourself by using a bunch of cool visual effects.
Today’s UX designers need to design user experiences of complex products with many branching flows — depending on how a user makes choices, how a user enters a particular screen from which entry point, and so on. Digital interactive products are obviously much more complex compared to a data-viz animation.
But regardless of the differences in complexity and media type, the fundamental approach remains the same. Just like compressing 7.7 billion people down to 1000 makes us understand more clearly, looking at how a content strategy and design system impact a data-viz animation gives us a clearer picture of their importance and impact.
This approach — having a content strategy, a deep understanding and analysis of content, and implementing that strategy into a design system — is what I learned from the Global Village animation, and it still serves as a foundation of my work today.
A bit of background: I worked as lead designer for the Global Village animation alongside Stephen So, under the direction of Krzysztof Lenk and Paul Kahn at Dynamic Diagrams in the year 2000. At the time, Krzysztof was a Professor at RISD (Rhode Island School of Design) and Creative Director at Dynamic Diagrams. Krzysztof and Paul presented Global Village at TED 2000 in Monterey, California. Dynamic Diagrams closed in 2012.
All statistics used in the Global Village animation were based on data available in the year 2000, representing the world of the late 1990s.